


How Does Food Delivery Charges Comparison Using Scraped Data Reveal Delivery Fee Differences?
Oct 05
Introduction
Food delivery platforms frequently apply different delivery fees, service charges, surge pricing, and promotional adjustments for similar restaurant orders. These variations can make the final payable amount differ significantly across applications, even when customers select the same restaurant, dishes, quantity, and delivery location.
With Web Scraping Food Data, businesses can collect structured information covering menu prices, delivery charges, minimum order requirements, discounts, service fees, and estimated delivery times. Comparing these fields across platforms creates a consistent pricing view that helps identify where fee differences originate and how frequently they change.
Instead of reviewing individual applications manually, businesses can compare thousands of restaurant listings and transactions across locations, time periods, and platforms to identify recurring pricing patterns, unusual fee changes, and customer-facing cost variations. Food Delivery Charges Comparison Using Scraped Data provides a practical framework for examining these differences at scale.
Mapping Delivery Fee Variations Across Competing Food Platforms
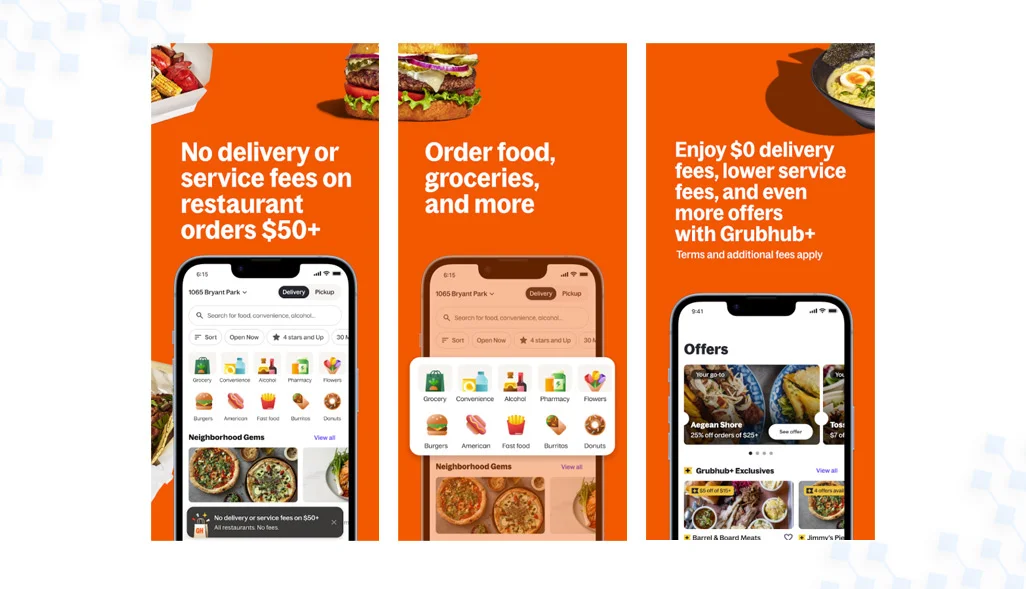
Using Food Delivery App Scraping in the middle of a systematic collection workflow can help capture delivery charges, restaurant details, menu information, minimum order thresholds, estimated delivery times, and promotional conditions. Factors such as delivery distance, order value, location, demand levels, restaurant agreements, membership benefits, and active promotions can influence the amount displayed before checkout.
Once standardized, these fields can be compared across restaurants and geographic areas. Such structured monitoring also supports Food Delivery Price Monitoring for Restaurants by giving teams a consistent view of how customer-facing prices change across competing services and ordering conditions. This provides a clearer foundation for identifying recurring differences between platforms operating within the same market.
Several important factors should be considered when comparing delivery charges:
- Delivery distance from restaurant to customer
- Minimum order requirements
- Peak-hour or demand-based charges
- Membership-related delivery benefits
- Restaurant-specific promotional offers
- Location-based pricing differences
| Pricing Factor | Platform A | Platform B | Platform C |
|---|---|---|---|
| Delivery Fee | $2.99 | $3.49 | $1.99 |
| Service Fee | $1.50 | $1.75 | $1.25 |
| Minimum Order | $15 | $12 | $18 |
| Estimated Delivery | 32 min | 28 min | 36 min |
Historical records can further reveal whether differences remain stable or appear only during specific periods. Businesses can compare hourly, daily, or weekly observations to identify recurring patterns and unusual changes. This makes fee comparison more useful for pricing research, restaurant partnerships, and customer-cost analysis across multiple delivery channels.
Connecting Menu Prices With Complete Customer Order Costs
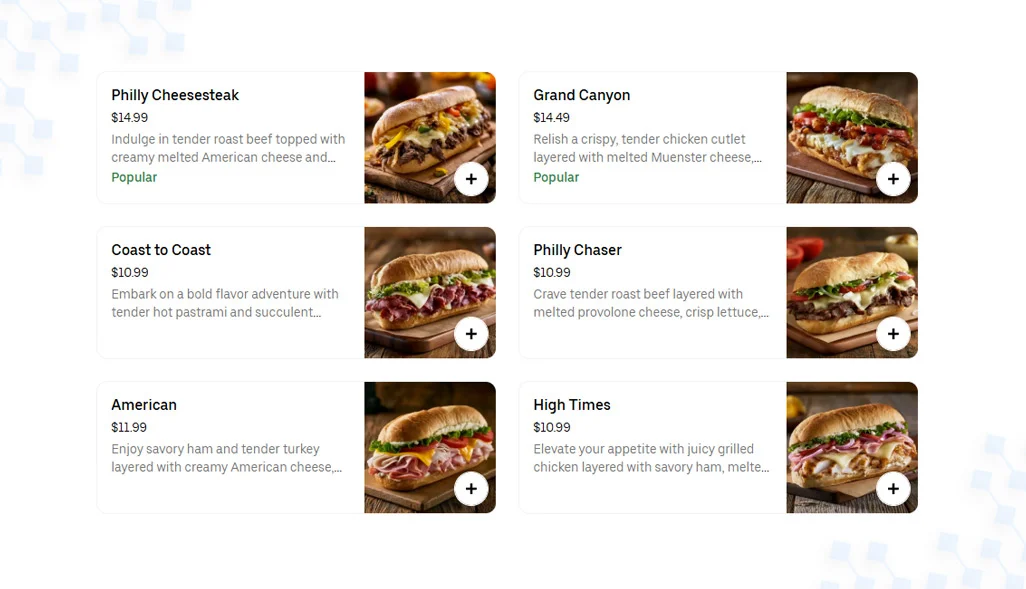
Comparing delivery charges alone does not provide a complete picture of what customers actually pay. Two platforms may display similar delivery fees while showing different menu prices, service charges, discounts, taxes, or minimum-order conditions. Structured Food and Restaurant Datasets can bring menu prices, restaurant identifiers, delivery charges, promotions, service fees, and other relevant fields into a consistent format.
Once these records are aligned, businesses can compare equivalent dishes and order combinations across platforms. The Benefits of Food Delivery Data Scraping for Restaurants become more practical when collected information supports historical comparisons, promotional analysis, pricing reviews, and location-specific assessment rather than one-time manual observations.
Key comparison areas can include:
- Base menu prices for identical dishes
- Delivery and service charges
- Discount and promotional values
- Minimum order thresholds
- Taxes and additional checkout fees
- Final payable order amounts
| Comparison Metric | Example Value | Business Relevance |
|---|---|---|
| Menu Price Difference | 8% | Pricing consistency |
| Delivery Fee Difference | 25% | Fee positioning |
| Service Fee Difference | 12% | Checkout impact |
| Discount Difference | 15% | Promotion analysis |
Historical order comparisons can also help identify whether a pricing difference is temporary or persistent. For example, a higher delivery charge may appear only during peak periods, while a menu-price difference may remain consistent over several weeks. Separating these patterns allows businesses to understand whether variations originate from delivery conditions, restaurant pricing, or platform-level charges.
Combining multiple cost components creates a more detailed picture of customer expenditure. Instead of comparing a single fee, teams can calculate estimated basket totals and evaluate how each component contributes to the difference. This supports more precise pricing research while providing useful information for restaurant negotiations, promotional planning, menu positioning, and platform performance analysis.
Monitoring Pricing Changes Through Automated Data Collection
Food delivery pricing can change throughout the day because of demand levels, delivery distance, promotional campaigns, restaurant availability, and platform-specific pricing rules. A single observation may therefore provide only a temporary view of the market. Repeated collection creates historical records that show when fees increase, decrease, or remain stable. This makes automated monitoring valuable for businesses that need consistent information across multiple restaurants, locations, and ordering platforms.
With Real-Time Food Delivery Price Tracking With Web Scraping, businesses can schedule collections at defined intervals and capture changes in delivery fees, menu prices, promotional offers, and estimated delivery times. The collected information can then be compared with earlier observations to identify meaningful movements. For larger operations, Food Data Scraping API Services for Businesses can provide structured access to collected records and support integration with dashboards, databases, analytics systems, or internal applications.
Important data points for continuous monitoring include:
- Delivery charges at different time intervals
- Menu price changes
- Promotional discounts and offers
- Estimated delivery times
- Restaurant availability
- Minimum order requirements
| Tracking Element | Collection Frequency | Potential Insight |
|---|---|---|
| Delivery Fees | Hourly | Fee fluctuations |
| Menu Prices | Daily | Pricing changes |
| Promotions | Multiple times daily | Campaign activity |
| Delivery Time | Hourly | Operational variation |
Automated records can also support competitor comparisons by showing how different platforms respond to similar market conditions. Businesses may examine whether fee changes occur simultaneously across services or whether individual platforms follow different patterns. Historical datasets make these comparisons easier because every observation can be evaluated against a consistent structure and defined time period.
The resulting information can support broader pricing studies, operational reviews, and market research. Food Delivery Competitor Price Analysis Using Web Scraping can incorporate delivery charges, menu prices, promotional activity, and service fees to create a wider comparison framework. Regular collection also reduces dependence on scattered manual checks and creates a repeatable process for analyzing pricing movements over time.
How Web Data Crawler Can Help You?
For businesses managing several restaurant locations or monitoring multiple delivery applications, manual comparison can become time-consuming and inconsistent. Food Delivery Charges Comparison Using Scraped Data can organize menu prices, delivery charges, service fees, promotions, delivery times, and restaurant information into structured datasets for regular analysis.
We can support the process through:
- Automated collection from selected food delivery platforms
- Scheduled extraction based on business requirements
- Standardized fields for cross-platform comparison
- Historical storage for trend and change analysis
- Structured outputs compatible with analytics systems
- Scalable collection across restaurants and locations
The collected information can be cleaned, categorized, and prepared for dashboards, reports, or internal pricing systems. A structured Food Delivery Data API for Multiple Platforms can further simplify access to continuously collected records, helping teams integrate delivery pricing information into existing business workflows.
Conclusion
Clear pricing comparisons require more than checking the delivery fee displayed at checkout. Food Delivery Charges Comparison Using Scraped Data brings menu prices, service charges, promotions, minimum order requirements, and delivery costs into a common analytical structure, making differences easier to measure across platforms and locations.
For restaurants and food businesses, Food Delivery Competitor Price Analysis Using Web Scraping can provide a broader view of how competitors position menu prices and customer-facing charges. Contact Web Data Crawler to build a customized food delivery data collection solution for your business.