How to Scrape IKEA Catalog Data for Style Trends Analysis and Analyze 69% Furniture Pricing Trends?
Nov 18

Introduction
The home furnishing market is evolving faster than ever, driven by rapid shifts in customer preferences and dynamic online retail strategies. With IKEA's massive online catalog offering thousands of SKUs, style collections, seasonal releases, product metadata, and pricing variations across regions, gaining structured insights from this ecosystem has become essential for business growth.
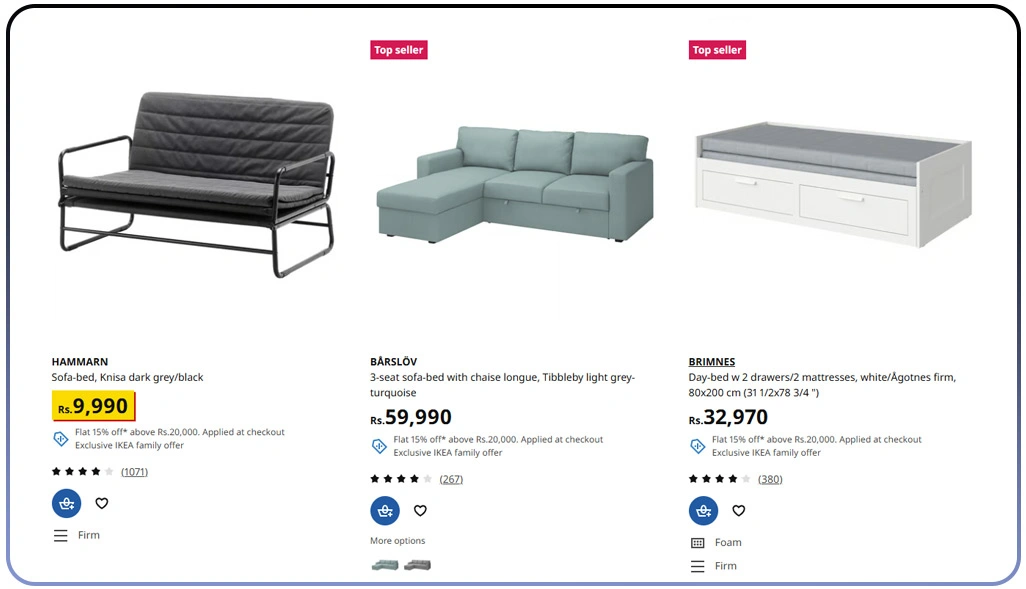
Modern businesses also require the capability to Scrape IKEA Product Data with precision to analyze how visual aesthetics, materials, product categories, sustainability preferences, and bundle offerings influence buying patterns. Such insights help in comparing style categories, monitoring real-time price fluctuations, and identifying popular catalog sections consumers interact with the most. As online and offline demand cycles converge, data-driven decision-making becomes the foundation of competitive advantage.
By continuing to Scrape IKEA Catalog Data for Style Trends Analysis, brands can benchmark competitors, understand price elasticity, track trending décor themes, and evaluate how quickly new releases gain traction across customer segments. This data-backed approach supports strategic planning for merchandising, promotions, and inventory optimization.
Emerging Style Patterns Revealed Through Catalog Insights
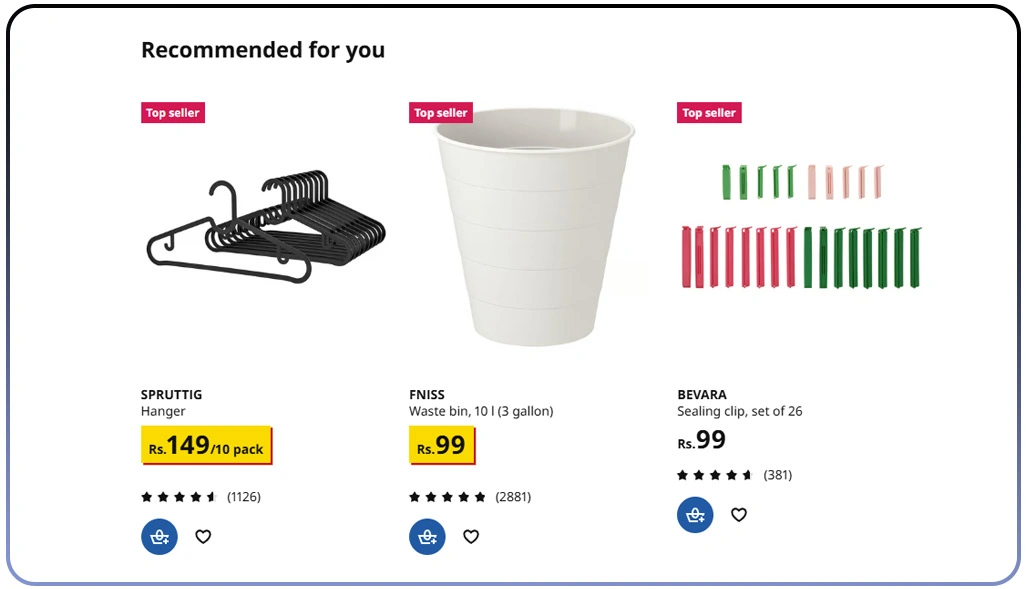
Understanding evolving design preferences requires structured intelligence capable of interpreting subtle catalog shifts across multiple furnishing categories. Businesses analyze product combinations, color palettes, and seasonal room setups to determine how styles gain traction among online shoppers. These insights also integrate effectively with Popular E-Commerce Data Scraping, enabling broader comparisons of home styling choices across multiple platforms.
As part of trend evaluation, retailers depend heavily on the IKEA Product Availability and Pricing Dataset, which helps measure how frequently design updates occur, which room types receive increased visibility, and how product clusters shift throughout the year. Visual components such as materials, shape patterns, lighting styles, and layout types provide additional layers of interpretation that strengthen retail strategy planning.
Trend Observation Table:
| Pattern Category | Dominant Visual Style | Popularity Score | YoY Growth % |
|---|---|---|---|
| Living Room Sets | Neutral fabrics + modular layouts | 8.7/10 | +14% |
| Bedroom Themes | Pastel palettes + warm textures | 9.1/10 | +19% |
| Kitchen Furnishings | Space-saving setups | 7.8/10 | +11% |
| Home Office | Minimalist + ergonomic | 9.3/10 | +26% |
By analyzing these curated trend layers backed by structured catalog data, brands can plan assortments, prepare for seasonal launches, and refine visual merchandising strategies. Such intelligence ensures a stronger foundation for product positioning and improves predictive accuracy for upcoming interior styling cycles.
Evaluating Pricing Signals and Metadata Behaviors Accurately
Understanding pricing patterns and comprehensive product metadata requires detailed, structured retail intelligence. This is where structured comparative analysis becomes essential, especially when connecting metadata attributes with price variations across market regions. The use of enriched E-Commerce Datasets allows companies to track discount frequencies, top-rated categories, seasonal price changes, and the tenure of newly introduced products.
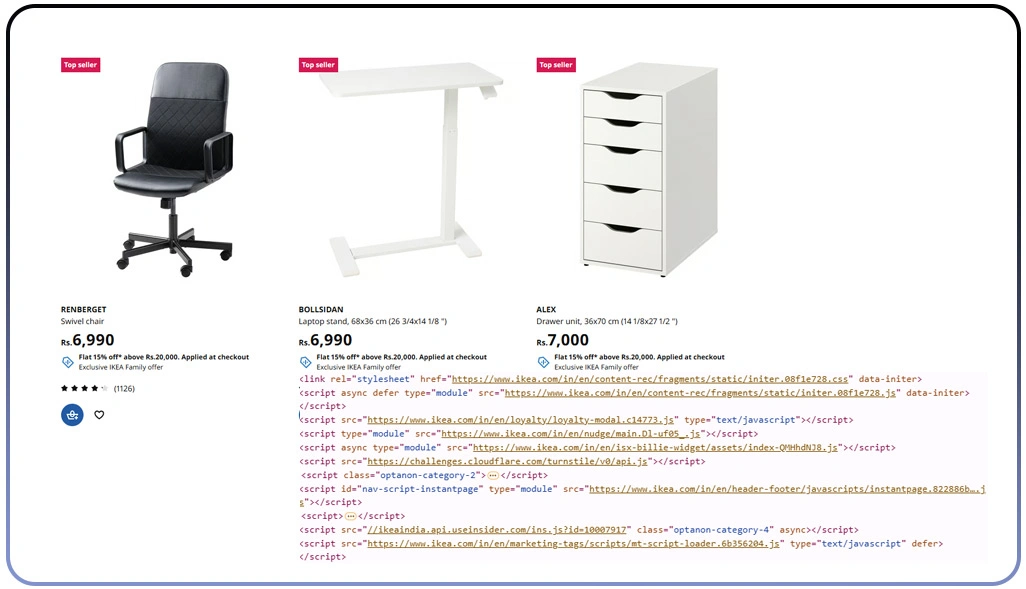
Technical teams also rely on the IKEA Catalog Scraper API to gather detailed metadata such as materials, size specifications, sustainability information, and item variants at scale. These metadata points highlight the characteristics that improve product catalog visibility and overall customer interest.
Pricing Insights Table:
| Product Category | Price Range | Average YoY Change | Stock Availability |
|---|---|---|---|
| Sofas | $299–$699 | +8% | 92% |
| Storage | $79–$249 | +6% | 95% |
| Dining Sets | $199–$499 | +11% | 87% |
| Bed Frames | $149–$599 | +9% | 89% |
These insights help shape pricing strategies, evaluate how catalog adjustments affect customer expectations, and highlight patterns in metadata relevance. Retailers gain a deeper understanding of catalog positioning and can accordingly plan promotions, update assortments, and enhance product offering clarity.
Assessing Regional Demand Through Inventory Intelligence Mapping
Regional analysis also benefits from structured datasets used to Scrape IKEA Store Locations Data in the USA, allowing businesses to assess how store-level availability corresponds with online catalog visibility. Combined with trend monitoring, this helps evaluate gaps between catalog listings and actual product availability, supporting better supply chain coordination.
Brands further analyze catalog attributes through Home Furnishing Data Trends, which add context to how visual styles correlate with regional demand. This enables retailers to refine assortment decisions, manage local stock levels effectively, and align merchandising strategies with customer expectations.
Regional Availability Table
| Region | Availability Score | Trending Category | Stock Movement % |
|---|---|---|---|
| West Coast | 91% | Minimalist Wood Themes | +14% |
| East Coast | 87% | Soft Furnishings | +11% |
| Midwest | 89% | Compact Furniture | +18% |
| South | 86% | Textured Designs | +9% |
This layered approach provides businesses with clarity on store-level performance, anticipated demand, and allocation efficiency. Retailers can adjust planning, strengthen regional strategies, and reduce mismatches between catalog expectations and real-time product availability.
How Web Data Crawler Can Help You?
Advanced businesses regularly depend on structured analytics to Scrape IKEA Catalog Data for Style Trends Analysis with accuracy, and we provide an end-to-end system built specifically for large-scale retail data extraction. We simplify the most complex extraction challenges by offering capabilities like visual mapping, attribute classification, structured metadata parsing, geolocation comparison, and trend segmentation.
How we assists your business:
- Collect large-volume furniture catalog data.
- Automate metadata extraction with structured output.
- Transform catalog visuals into usable insights.
- Track frequent updates in product prices.
- Monitor availability trends for multiple regions.
- Improve reporting accuracy for retail teams.
With scalable delivery pipelines, automated validation checks, and custom data feeds, We ensure you get consistent and meaningful insights for merchandising, design planning, and competitive pricing strategies. Businesses can utilize these solutions while benefiting from enhanced analytics supported by IKEA Product Metadata Extraction.
Conclusion
Modern retailers rely on evolving data ecosystems to interpret design changes, pricing patterns, and catalog shifts, creating a smarter path for business planning. By continuing to Scrape IKEA Catalog Data for Style Trends Analysis, brands strengthen their ability to act quickly, build targeted merchandising strategies, and respond effectively to customer expectations.
Access to deep analytical layers helps teams evaluate product gaps, competitor movements, availability fluctuations, and design benchmarks supported by IKEA Catalog Scraping for Retail Insights. Contact Web Data Crawler today for tailored catalog intelligence solutions.