


How to Extract Real-Time Food Pricing Trends Data Across Regions and Spot Key Menu Price Shifts?
Sep 11
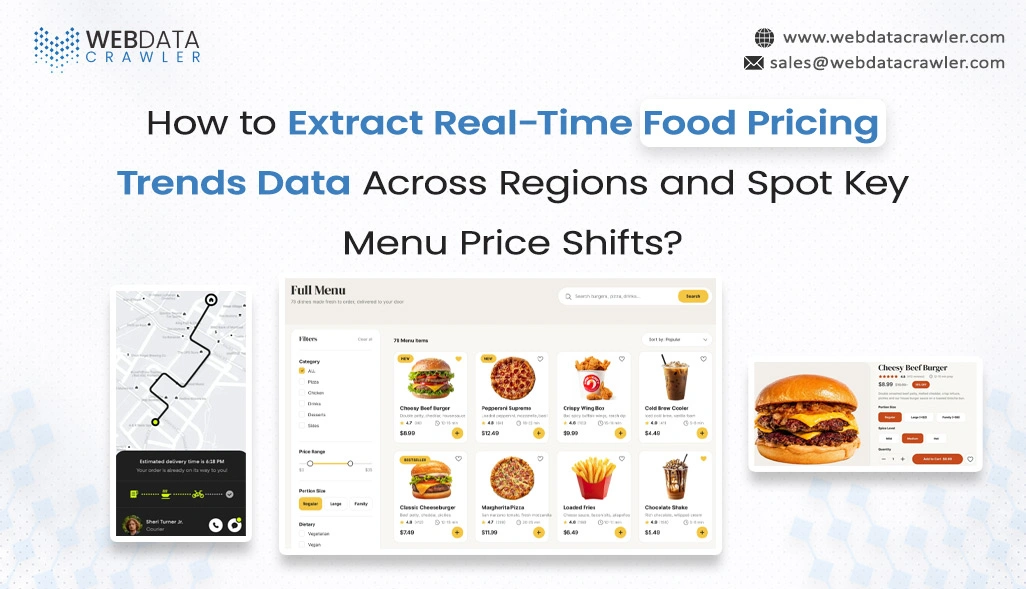
Introduction
Food delivery platforms continuously update menu prices according to regional demand, competition, ingredient costs, promotions, and operating conditions. These changes create valuable market signals for restaurants, aggregators, retailers, and analysts. Structured Web Scraping Food Data helps convert frequently changing menu information into organized records for regional pricing comparisons and trend analysis.
Prices for identical dishes can vary significantly between cities because customer preferences, local competition, delivery conditions, and promotional strategies differ by market. Businesses can Extract Real-Time Food Pricing Trends Data to compare these variations, identify categories experiencing upward or downward movement, and understand how pricing behavior changes across different geographic areas.
Consistent monitoring also creates a historical view of menu movements rather than relying on isolated observations. Tracking item prices, discounts, restaurant information, ratings, and availability at regular intervals helps teams identify recurring patterns and unusual changes. This supports stronger benchmarking, competitive analysis, pricing decisions, and market planning across food delivery ecosystems.
Regional Menu Variations Reveal Emerging Food Pricing Patterns
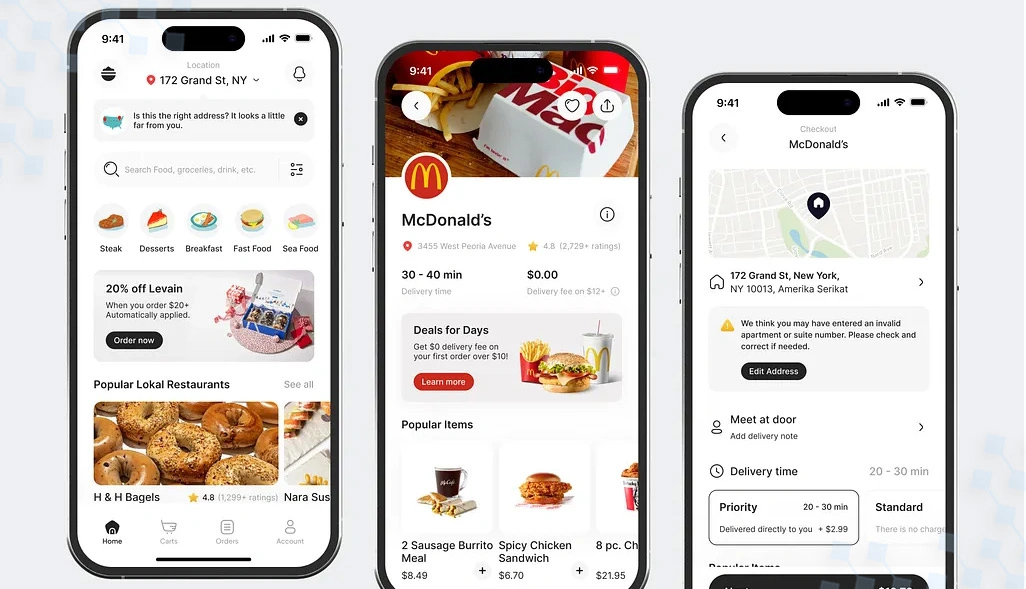
Food delivery pricing can differ considerably between cities, even when restaurants offer similar dishes and portion sizes. Local competition, consumer preferences, operating expenses, delivery conditions, and promotional campaigns all contribute to these differences. Collecting structured menu information allows businesses to compare pricing behavior across regions and identify markets where particular categories are becoming more expensive or more promotional.
A broader dataset becomes especially useful when analysts compare multiple restaurant categories over several collection periods. Scrape Food Delivery Menu Prices Datasets can organize item names, prices, discounts, restaurant locations, categories, and timestamps into consistent records. This makes it easier to examine how individual menu items behave and whether regional differences are temporary or part of a longer pattern.
Historical records can also help distinguish ordinary fluctuations from significant market movements. When Food and Restaurant Datasets are combined with location-specific observations, analysts can evaluate average prices, discount frequency, menu changes, and availability rates across selected markets. This creates a clearer foundation for regional benchmarking and category-level comparisons.
Key indicators can include:
- Average item prices by city
- Regional discount frequency
- Restaurant-level price changes
- Menu availability percentages
- Category-wise pricing movements
Indicator, Region A, Region B, and Region C:
| Indicator | Region A | Region B | Region C |
|---|---|---|---|
| Average Menu Price | $14.20 | $15.80 | $13.90 |
| Discounted Items | 18% | 25% | 14% |
| Price Increase | 7.2% | 9.5% | 5.8% |
| Availability Rate | 94% | 91% | 96% |
These illustrative figures show how regional markets can demonstrate different pricing behavior. Repeated observations provide stronger evidence for identifying persistent movements and developing informed pricing strategies.
Consistent Tracking Highlights Important Menu Price Movements
Menu prices can change gradually, making occasional checks insufficient for identifying meaningful shifts. Regular data collection creates a timeline that shows how prices develop across individual dishes, restaurants, categories, and locations. Comparing multiple observations makes it easier to detect steady increases, temporary reductions, promotional periods, and unusual pricing activity.
For regional analysis, Regional Food Delivery Pricing Trends Scraping can capture comparable menu information from selected markets at recurring intervals. Standardized fields allow analysts to compare the same products across different dates while reducing inconsistencies caused by varying layouts, descriptions, and category structures. This supports more reliable historical analysis and market benchmarking.
Automation can further improve collection frequency and consistency. A properly configured Scraping API can connect recurring extraction workflows with databases, dashboards, or analytical environments. Instead of depending on manually collected snapshots, businesses can establish repeatable processes that continuously organize price observations and associated menu attributes.
Useful tracking activities include:
- Monitoring recurring menu price changes
- Comparing prices between geographic markets
- Recording promotional periods
- Measuring category-level price movement
- Maintaining timestamped historical records
Tracking Indicator, Week 1, Week 2, and Week 3:
| Tracking Indicator | Week 1 | Week 2 | Week 3 |
|---|---|---|---|
| Average Pizza Price | $12.40 | $12.90 | $13.30 |
| Average Burger Price | $10.80 | $11.10 | $11.60 |
| Promotional Listings | 21% | 24% | 29% |
| Menu Changes | 8% | 11% | 15% |
These sample figures illustrate how repeated monitoring can reveal gradual changes that may remain unnoticed during occasional checks. Historical comparisons can then support pricing reviews, regional benchmarking, promotional evaluation, and category-level market analysis.
Restaurant-Level Signals Strengthen Regional Price Comparisons
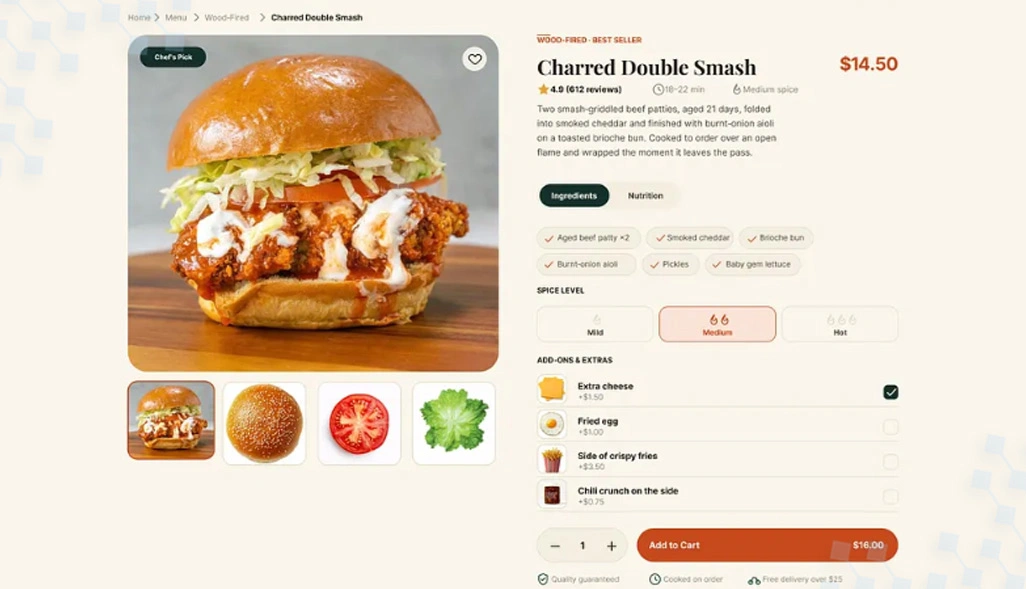
Restaurant-level information provides another layer of detail when evaluating food pricing movements. Category averages can show broad market direction, but individual restaurant records reveal how specific brands and locations respond to local conditions. Comparing these records can highlight restaurants that adjust prices frequently, maintain stable pricing, or introduce discounts more aggressively.
Detailed restaurant information becomes particularly useful when examining large geographic markets. Businesses can Extract Zomato Restaurant Data to organize relevant restaurant and menu attributes for structured comparisons. Combining restaurant identifiers, locations, categories, prices, ratings, and availability can provide a more complete view of how menu offerings change across different markets.
Collection quality also matters when monitoring numerous restaurants over time. Professional Web Scraping Services can support recurring workflows that capture information from multiple sources and maintain consistent structures. Validation and normalization processes can help reduce duplicate records, inconsistent categories, missing values, and other issues that can affect regional comparisons.
Important restaurant-level signals include:
- Individual menu price movements
- Restaurant category changes
- Location-based price differences
- Promotional listing frequency
- Availability fluctuations
Restaurant Category, Price Shift, Menu Changes, and Availability:
| Restaurant Category | Price Shift | Menu Changes | Availability |
|---|---|---|---|
| Fast Food | 8.4% | 13% | 95% |
| Italian | 6.7% | 10% | 92% |
| Indian | 9.1% | 16% | 94% |
| Chinese | 7.3% | 12% | 93% |
These illustrative figures demonstrate how category-level movements can vary within the same market. Combining restaurant-level observations with timestamps and geographic information creates a stronger basis for identifying recurring pricing behavior and regional market differences.
How Web Data Crawler Can Help You?
A structured crawling framework can collect food delivery information from multiple sources while maintaining consistent fields, timestamps, and geographic attributes. This helps businesses compare menu prices, promotional activity, availability, restaurant information, and category-level changes across markets. With recurring collection workflows, teams can Extract Real-Time Food Pricing Trends Data according to selected regions, platforms, categories, and monitoring intervals.
Key capabilities include:
- Automated collection across multiple food delivery platforms
- Region-wise monitoring of menu prices and promotions
- Scheduled extraction for recurring market analysis
- Standardized datasets with consistent fields
- Historical storage for pricing comparisons
- Validation processes for improved data consistency
After collection, records can be organized for dashboards, reports, benchmarking, and analytical workflows. Food Data Scraping API Extraction can connect continuously collected information with internal databases, analytics environments, or customized reporting systems. This reduces repetitive manual work while creating a dependable foundation for monitoring changing food markets.
Conclusion
Food delivery markets generate continuous pricing signals through menu updates, promotional offers, availability changes, and restaurant-level adjustments. A structured collection framework helps businesses interpret these movements consistently and compare regional behavior over time. By combining recurring monitoring with historical records, teams can Extract Real-Time Food Pricing Trends Data to support stronger pricing intelligence and market analysis.
Regional comparison also becomes more practical when restaurant, menu, category, location, and timestamp information are maintained in consistent formats. Regional Food Delivery Pricing Trends Scraping can support these workflows by providing regularly collected information for selected platforms and geographic markets. Contact Web Data Crawler today to build a customized food pricing data collection solution for your target regions.