How to Extract Store-Wise Grocery Prices With Location Variations to Track 35% Price Gaps Across Cities?
April 24

Introduction
Retail pricing is no longer uniform across regions, and grocery retailers are experiencing noticeable fluctuations based on geography, demand patterns, and logistics. These variations often result in price gaps of up to 35% between cities, directly impacting customer perception and competitive positioning. This is where Web Scraping Grocery Data becomes an essential strategy, enabling brands to gather real-time pricing insights across multiple stores and regions.
To effectively Extract Store-Wise Grocery Prices with Location Variations, companies must build systems that monitor product-level pricing across different store locations. From urban metros to smaller towns, grocery prices vary due to supply chain costs, regional demand, and promotional strategies. Without structured data collection, these insights remain fragmented and unusable.
A data-driven approach helps retailers identify pricing inconsistencies, optimize their pricing strategies, and respond quickly to competitors. By combining location intelligence with automated extraction tools, businesses can create a unified view of pricing trends. This allows them to make smarter decisions, reduce margin loss, and improve customer retention while staying aligned with regional pricing dynamics.
Analyzing Regional Grocery Pricing Patterns Across Different Markets
Understanding how grocery prices fluctuate across regions is critical for businesses aiming to improve pricing strategies. Regional variations are often influenced by logistics, demand-supply gaps, and localized promotions, making it difficult to maintain consistent pricing. Without structured analysis, retailers may overlook key differences that impact revenue and customer perception.
To address this, businesses rely on structured datasets and analytical frameworks that highlight price differences across multiple locations. Integrating Quick Commerce Datasets allows organizations to capture rapidly changing prices and identify short-term fluctuations driven by demand spikes. This approach helps retailers stay aligned with dynamic pricing environments and respond quickly to market changes.
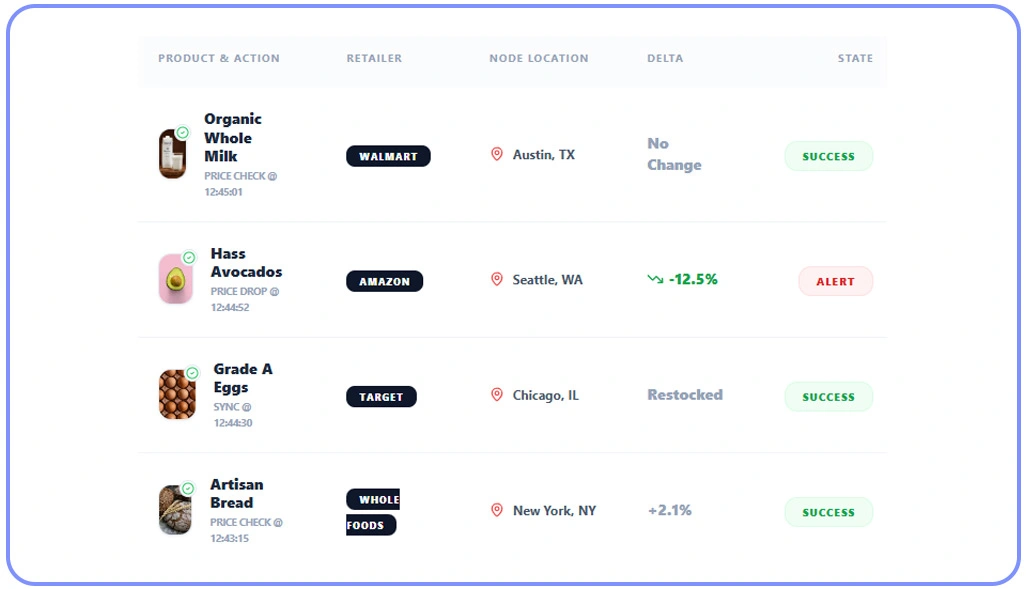
A well-implemented Location Based Grocery Price Tracking System enables continuous monitoring of pricing variations, ensuring businesses maintain visibility into regional trends. This system helps identify areas where prices are significantly higher or lower, allowing for better pricing alignment.
| Product | City A Price | City B Price | City C Price | Price Gap (%) |
|---|---|---|---|---|
| Rice (1kg) | ₹60 | ₹75 | ₹82 | 36% |
| Milk (1L) | ₹50 | ₹55 | ₹60 | 20% |
| Cooking Oil | ₹120 | ₹140 | ₹150 | 25% |
By analyzing such data, businesses can refine pricing strategies, reduce inconsistencies, and improve competitiveness. These insights also support better decision-making, enabling retailers to optimize pricing based on regional demand patterns and cost structures.
Evaluating City-Level Grocery Pricing Differences for Strategy
City-level pricing analysis plays a crucial role in shaping competitive strategies within the grocery sector. Different cities exhibit unique pricing behaviors influenced by purchasing power, supply chain efficiency, and local competition. Without a structured comparison, businesses may fail to identify opportunities for pricing optimization.
Organizations use automated data collection tools powered by Live Crawler Services to gather accurate pricing information across multiple cities. This enables continuous tracking and comparison of prices, ensuring businesses have access to up-to-date insights for decision-making.
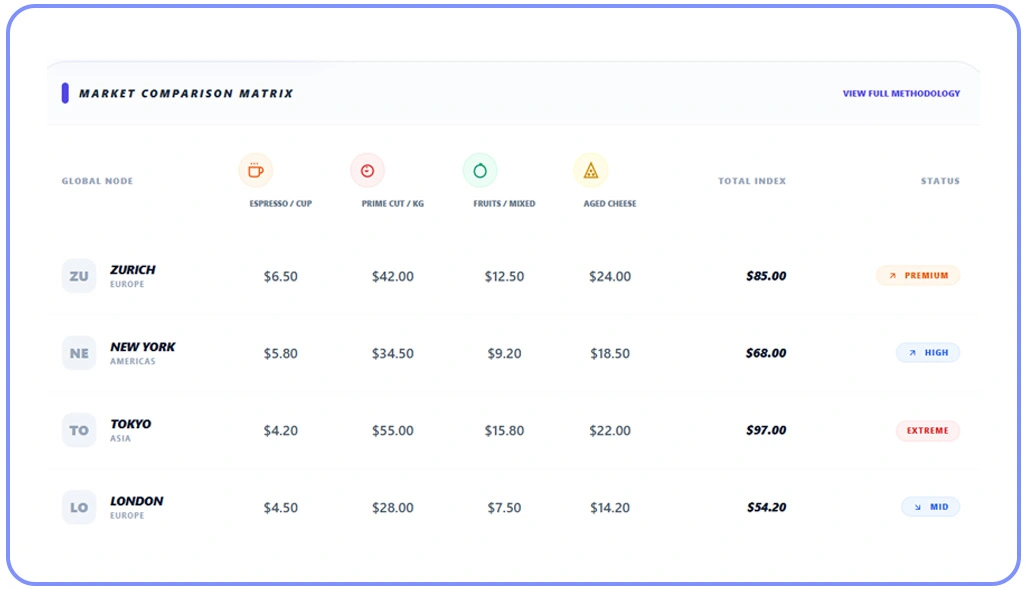
A comprehensive Grocery Price Comparison by City for Real Insights allows retailers to evaluate how pricing varies across urban and semi-urban areas. These comparisons help identify pricing gaps and determine where adjustments are necessary to remain competitive.
| Category | Metro City | Tier 2 City | Tier 3 City | Variation (%) |
|---|---|---|---|---|
| Fruits | ₹120 | ₹100 | ₹90 | 25% |
| Vegetables | ₹80 | ₹70 | ₹60 | 25% |
| Packaged Goods | ₹200 | ₹180 | ₹160 | 20% |
Additionally, these insights support demand forecasting and inventory planning, helping businesses optimize operations and enhance customer satisfaction. By leveraging city-level analysis, organizations can maintain a competitive edge in a rapidly evolving retail landscape.
Converting Grocery Pricing Data into Actionable Insights Efficiently
Collecting grocery pricing data is only the first step; transforming it into actionable insights is essential for effective decision-making. Businesses must process and analyze large volumes of data to identify meaningful trends and opportunities for optimization. Without proper analysis, raw data remains underutilized and fails to deliver value.
Advanced data extraction tools such as a Scraping API enable efficient collection of pricing data across multiple stores and regions. These tools ensure accuracy and scalability, allowing businesses to build reliable datasets for analysis.
Techniques like Geo Pricing Data Scraping for Grocery help organizations map pricing variations geographically, providing a clear understanding of regional trends. Additionally, Scraping Grocery Prices by Store and Region for Analysis allows businesses to identify specific areas where pricing adjustments are needed.
| Region | Avg Price | Competitor Avg | Difference | Action Needed |
|---|---|---|---|---|
| North Zone | ₹110 | ₹120 | -10 | Increase |
| South Zone | ₹130 | ₹125 | +5 | Optimize |
| West Zone | ₹115 | ₹140 | -25 | Adjust |
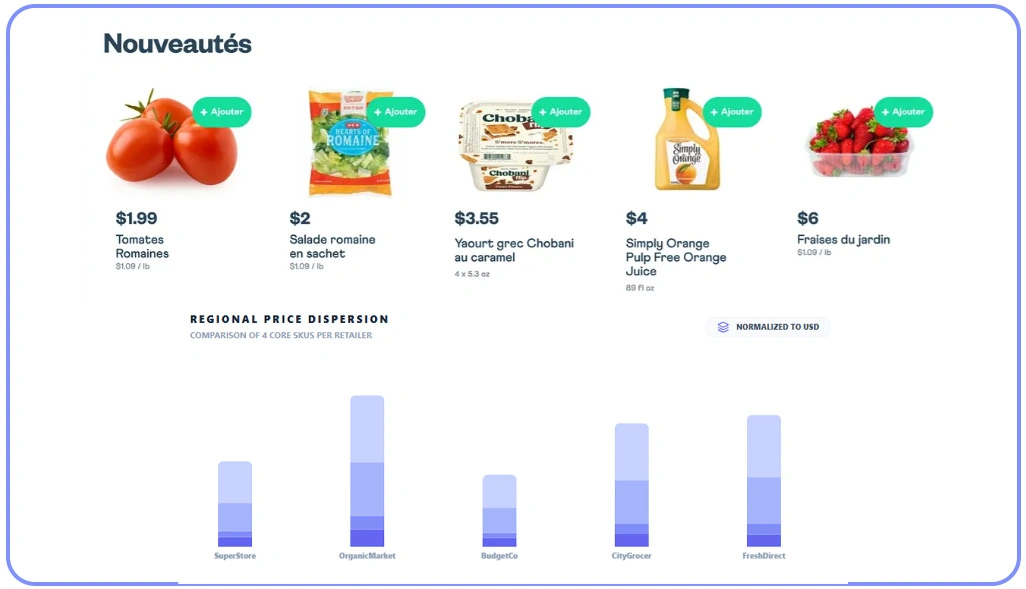
To enhance usability, businesses can Build Location Based Price Comparison Dashboard via Crawler, enabling real-time visualization of pricing trends. These dashboards provide actionable insights that support quick and informed decisions. By converting raw data into structured insights, organizations can refine pricing strategies, improve competitiveness, and achieve better business outcomes.
How Web Data Crawler Can Help You?
Retailers looking to scale their pricing intelligence capabilities require a structured and automated approach to data extraction. By implementing systems that Extract Store-Wise Grocery Prices with Location Variations, businesses can build a centralized repository of pricing data across regions and stores.
Key Capabilities Include:
- Automated data extraction from multiple grocery platforms.
- Real-time monitoring of price fluctuations across locations.
- Data normalization for consistent analysis.
- Integration with analytics and BI tools.
- Scalable infrastructure for large datasets.
- Customizable reporting for business needs.
These solutions empower businesses to move beyond manual tracking and adopt a data-driven approach to pricing. In addition, companies can integrate insights into a Location Based Grocery Price Tracking System to ensure continuous optimization and competitive advantage.
Conclusion
Retail pricing strategies require a deep understanding of regional variations to remain effective. Businesses that implement systems to Extract Store-Wise Grocery Prices with Location Variations can identify hidden price gaps and respond with precision. This approach ensures better alignment with market conditions and improves overall profitability.
At the same time, adopting a Grocery Price Comparison by City for Real Insights helps organizations refine their pricing models and stay competitive across regions. Get started today with Web Data Crawler advanced data extraction solutions to drive smarter pricing decisions and maximize your retail performance.