How Data Transformation for Tableau & Power BI From Web Scraping Simplifies Complex BI Workflows?
May 06

Introduction
Modern businesses rely heavily on data-driven decisions, but raw web data is often unstructured, inconsistent, and difficult to interpret. This is where Data Transformation for Tableau & Power BI From Web Scraping becomes essential. It bridges the gap between raw extracted data and meaningful insights by converting fragmented datasets into structured, analysis-ready formats.
With the increasing adoption of AI Web Scraping Services, organizations can collect vast amounts of data from multiple sources such as e-commerce platforms, travel portals, and social media. However, without proper transformation, this data remains underutilized. According to industry reports, nearly 80% of analytics time is spent on cleaning and preparing data rather than analyzing it.
Transforming scraped data into formats compatible with Tableau and Power BI ensures seamless visualization and reporting. It eliminates inconsistencies, standardizes formats, and enables real-time analytics capabilities. In this blog, we will explore how transforming web scraped data simplifies BI workflows, reduces complexity, and enhances decision-making through structured processes and scalable data pipelines.
Transforming Unstructured Web Data Into Reliable Analytical Datasets
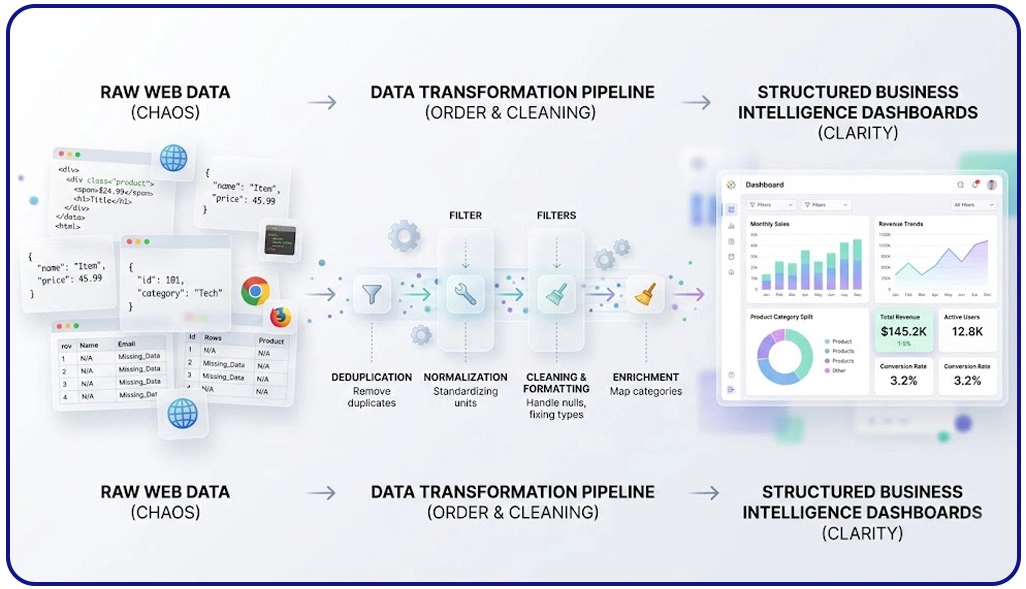
Handling raw web data often introduces inconsistencies such as duplicates, missing values, and mismatched formats, which directly affect reporting accuracy. To overcome this, businesses rely on structured workflows like ETL Process for Web Scraped Data in Business Intelligence, ensuring that extracted data is cleaned, normalized, and transformed into analysis-ready formats. This approach significantly reduces manual errors and improves data quality across reporting systems.
A critical application of refined datasets is Competitive Benchmarking, where organizations compare pricing, availability, and customer sentiment across multiple competitors. Without proper transformation, these comparisons can produce misleading results. Clean datasets ensure accurate comparisons and actionable insights for strategic decisions.
Core Data Refinement Workflow:
| Step | Description | Impact on Insights |
|---|---|---|
| Data Cleaning | Eliminates duplicates and inconsistencies | Improves reliability |
| Standardization | Aligns formats like currency and dates | Ensures uniformity |
| Data Enrichment | Adds missing or external contextual data | Enhances depth |
| Validation | Verifies data accuracy and completeness | Builds trust |
Studies show that nearly 70% of data inconsistencies originate during extraction and initial processing stages. Addressing these issues early ensures smoother analytics workflows and more dependable reporting outputs.
By implementing structured transformation processes, organizations can streamline reporting pipelines, minimize operational inefficiencies, and improve decision-making accuracy. This ultimately allows analysts to focus on extracting insights rather than correcting flawed datasets.
Designing Scalable Systems for Continuous Data Processing and Integration
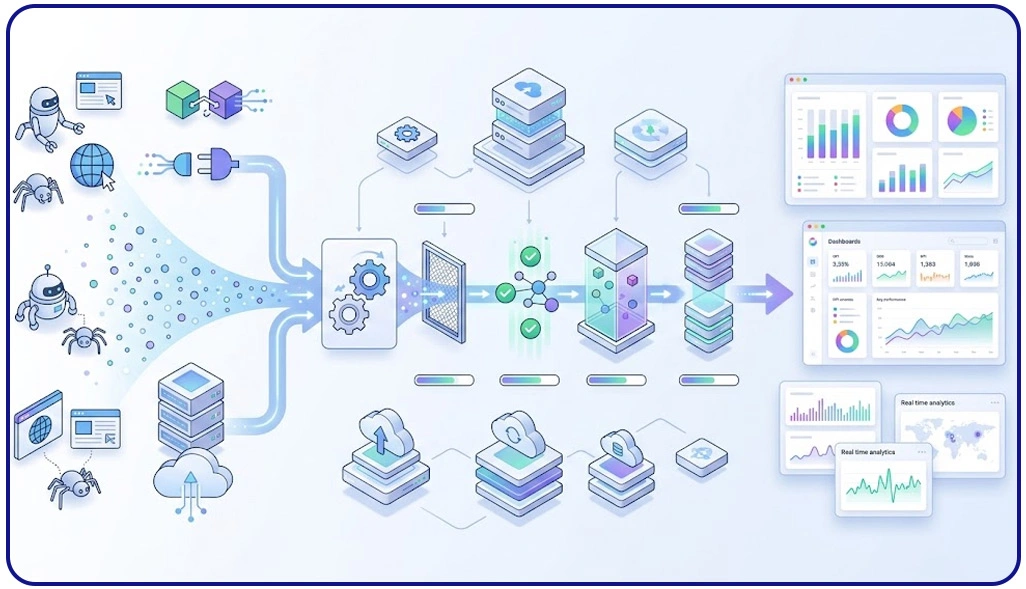
As data volumes grow, organizations must adopt scalable systems that can handle continuous inflow without compromising performance. This is where Building Data Pipelines in Power BI & Tableau for Scraped Data becomes essential, enabling seamless movement of data from extraction to visualization. These pipelines automate repetitive tasks, reducing manual intervention and ensuring consistent data availability.
Large-scale operations often depend on Enterprise Web Crawling to gather high volumes of information across multiple platforms. However, without efficient processing systems, this data can become overwhelming and difficult to manage. Automated pipelines ensure that incoming data is structured, validated, and stored in a format ready for analysis.
Pipeline Architecture Components:
| Component | Function | Business Value |
|---|---|---|
| Data Ingestion | Captures data from various sources | Real-time updates |
| Transformation | Cleans and organizes incoming data | Improved quality |
| Storage | Maintains processed datasets | Easy accessibility |
| Visualization Prep | Prepares data for dashboard tools | Faster insights |
Research indicates that automated pipelines can reduce processing delays by up to 60%, allowing businesses to respond quickly to market changes. Additionally, these systems ensure consistency across datasets, minimizing discrepancies and improving reporting accuracy.
By implementing scalable architectures, organizations can efficiently manage large datasets, maintain data integrity, and support real-time analytics, ultimately simplifying complex business intelligence workflows.
Optimizing Prepared Data for High-Performance Visual Analytics
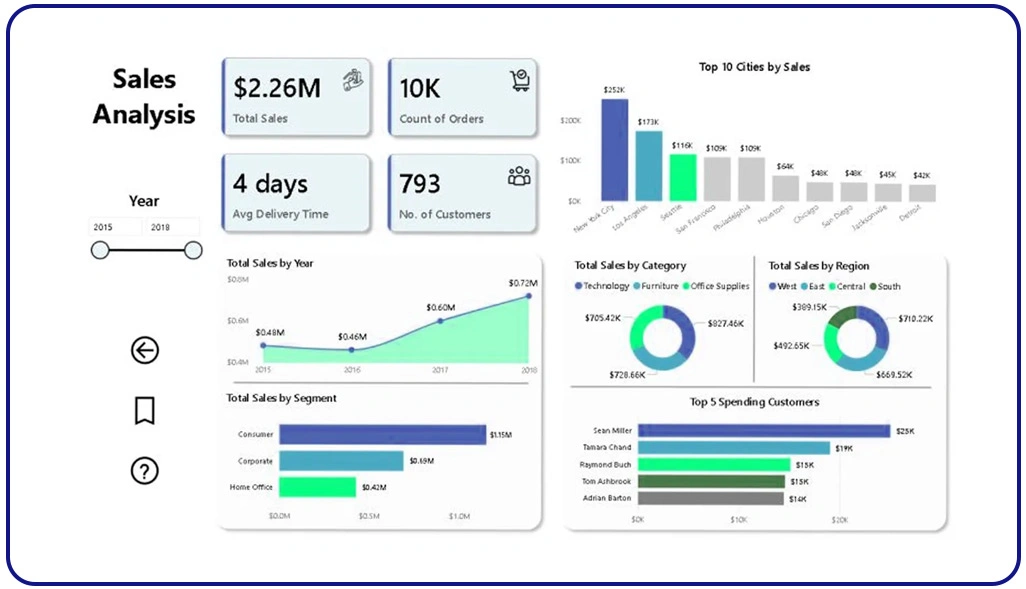
Effective visualization depends on how well the underlying data is prepared and structured. Poorly formatted datasets can lead to slow dashboards and inaccurate insights. The process of Preparing Large Scale Scraped Data for Visualization in Tableau ensures that data is optimized for performance, enabling faster queries and smoother interactions.
Another key step is How to Integrate Scraped Data Into Power BI and Tableau, which involves aligning datasets, creating relationships, and ensuring compatibility with BI tools. To support efficient data flow, modern systems rely on a Scraping API, which enables automated data collection and transformation. APIs help maintain up-to-date datasets, ensuring that dashboards always reflect the latest information.
Optimization Techniques for Visualization:
| Technique | Purpose | Result |
|---|---|---|
| Data Aggregation | Summarizes large datasets | Faster processing |
| Data Modeling | Establishes relationships between data | Better insights |
| Indexing | Enhances data retrieval speed | Improved performance |
| Filtering | Removes irrelevant data | Cleaner dashboards |
Industry reports suggest that optimized data preparation can improve dashboard performance by nearly 50%. This ensures that users can analyze data efficiently without delays or disruptions.
Additionally, automation supports Scrape Automated Data Transformation for Power BI Dashboards, reducing manual workload and ensuring consistent results. By focusing on structured preparation and integration, businesses can deliver high-quality visual analytics and improve overall decision-making efficiency.
How Web Data Crawler Can Help You?
Organizations dealing with large-scale data often struggle with complexity, inconsistency, and time-consuming manual processes. Implementing Data Transformation for Tableau & Power BI From Web Scraping helps streamline workflows and ensures that data is always ready for analysis.
We provide end-to-end solutions to simplify your data journey:
- Collect structured and unstructured data from multiple sources
- Clean and standardize datasets for better accuracy
- Automate workflows to reduce manual intervention
- Ensure seamless integration with BI tools
- Deliver real-time data updates for faster decisions
- Maintain high data quality and consistency
Our expertise ensures that your business can focus on insights rather than data preparation challenges. With our solutions, businesses can also implement Building Data Pipelines in Power BI & Tableau for Scraped Data to ensure continuous data flow and improved analytics efficiency.
Conclusion
Efficient data transformation is the foundation of successful business intelligence strategies. Implementing Data Transformation for Tableau & Power BI From Web Scraping ensures that data is accurate, consistent, and ready for visualization, enabling faster and more informed decision-making.
As businesses continue to rely on data-driven insights, adopting structured approaches such as ETL Process for Web Scraped Data in Business Intelligence becomes essential. These methods not only improve efficiency but also enhance scalability and reliability. Connect with Web Data Crawler today and take the first step toward smarter, data-driven decisions.