What Makes Cdiscount Data Scraping for Marketplace Sales Trends Analysis Boost Seller Insights by 37%?
Feb 26

Introduction
France's leading eCommerce platform, Cdiscount, hosts millions of active listings across electronics, fashion, home goods, and more. For sellers, this vast ecosystem presents both opportunity and complexity. With fluctuating prices, seasonal demand spikes, and intense category competition, manual monitoring is no longer practical. Businesses aiming to refine their product strategy increasingly rely on Cdiscount Data Scraping for Marketplace Sales Trends Analysis to decode real-time marketplace dynamics.
Retailers aiming to Scrape Cdiscount Product Data can analyze historical price shifts, bestseller rankings, stock availability, and promotional cycles. These insights directly impact assortment planning and dynamic pricing decisions. In fact, sellers who adopt structured marketplace intelligence solutions report up to a 37% improvement in revenue optimization accuracy due to more informed pricing and inventory decisions.
By tracking category-level growth trends, customer sentiment indicators, and competitor positioning, businesses can forecast demand with greater precision. This approach helps brands identify which SKUs are accelerating, which categories are saturated, and which price tiers deliver consistent conversions. As online competition intensifies, data-driven marketplace analytics becomes essential for improving seller insights and long-term profitability.
Detecting Emerging Product Segments Through Advanced Marketplace Monitoring

Understanding category expansion on Cdiscount requires consistent tracking of listing behavior, seller competition, and demand acceleration signals. Many retailers misjudge category maturity because they rely only on visible bestseller lists. Instead, structured Cdiscount Marketplace Data Extraction enables sellers to analyze listing growth, SKU turnover rates, and discount frequency shifts across subcategories.
When retailers aim to Scrape Cdiscount Product Data, they gain access to granular insights such as seller density, price dispersion, and ranking volatility. These signals highlight underserved micro-niches and seasonal demand surges before they become saturated.
Category Performance Snapshot:
| Category | Avg. Price (€) | Monthly Listings Growth | Bestseller Turnover Rate | Discount Frequency |
|---|---|---|---|---|
| Electronics | 289 | +8% | High | 32% |
| Home Appliances | 175 | +12% | Medium | 27% |
| Toys & Games | 39 | +18% | Very High | 41% |
| Fashion | 52 | +5% | Medium | 22% |
For example, Toys & Games showing 18% listing growth and high turnover suggests strong buyer activity, yet rising competition. Sellers responding early can rebalance inventory, refine product bundles, and adjust promotional cadence. This proactive strategy reduces overstock exposure and improves sell-through efficiency.
Businesses that apply structured Ecommerce Scraping Services typically report 20–30% better inventory allocation accuracy compared to manual analysis. By focusing on structured category intelligence, retailers move beyond reactive decision-making and align stock positioning with measurable marketplace growth signals.
Refining Competitive Pricing with Structured Data Modeling
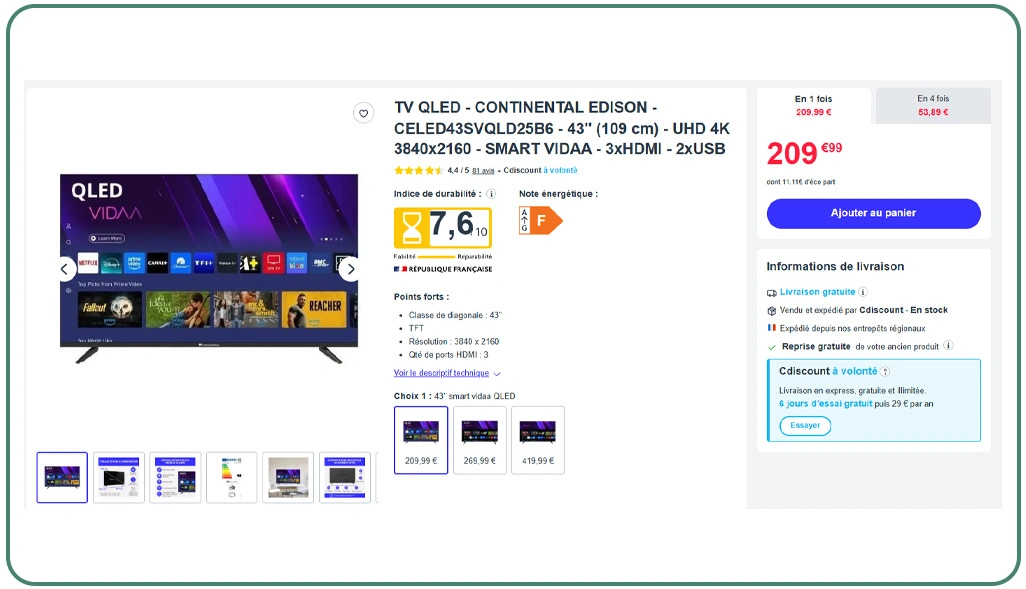
Price fluctuations significantly influence visibility and conversion rates. On Cdiscount, even minor pricing gaps can alter ranking positions and buyer preference. Implementing a Cdiscount Product Pricing Data Scraper allows retailers to monitor real-time pricing tiers, discount frequency, and promotional clustering.
When organized into structured E-Commerce Datasets, this information supports algorithmic repricing models and margin forecasting strategies. Sellers often observe that mid-tier pricing segments generate stronger and more stable conversion rates compared to both low-cost and premium brackets. Data modeling also reveals recurring promotional spikes during month-end and seasonal campaigns.
Competitive Pricing Distribution:
| Price Tier (€) | % of Listings | Avg. Discount Rate | Conversion Trend |
|---|---|---|---|
| 0–50 | 34% | 18% | Stable |
| 51–150 | 29% | 22% | Growing |
| 151–300 | 21% | 27% | Volatile |
| 300+ | 16% | 15% | Premium Segment |
In this dataset, the €51–150 bracket demonstrates balanced pricing elasticity and consistent growth. Sellers leveraging pricing analytics often reduce margin erosion by up to 17% while improving Buy Box positioning.
By continuously benchmarking competitors, retailers transition from reactive markdown strategies to predictive adjustments. This improves pricing stability, strengthens profitability, and supports data-driven competitiveness across fluctuating market cycles.
Monitoring Consumer Engagement Signals for Demand Forecasting
Beyond pricing, product popularity indicators provide strong forecasting signals. Retailers that apply Web Scraping Cdiscount Product Popularity Insights analyze review velocity, rating trends, bestseller badges, and stock-out frequency to measure true demand momentum.
Automated collection via a structured Scraping API ensures scalable monitoring across thousands of listings daily. Customer engagement trends often precede sales spikes. Products experiencing review growth above 20% typically indicate rising demand or increased marketing visibility.
Popularity Metrics Comparison:
| Product Type | Avg. Rating | Monthly Review Growth | Rank Movement | Stock-Out Frequency |
|---|---|---|---|---|
| Smartphones | 4.4 | +14% | Upward | Medium |
| Coffee Machines | 4.6 | +19% | Strong Up | High |
| Gaming Consoles | 4.3 | +11% | Moderate | Low |
| Air Fryers | 4.7 | +23% | Rapid Up | High |
Air Fryers, for instance, demonstrate 23% review growth and frequent stock-outs, signaling strong and accelerating consumer interest. Sellers responding early by increasing stock levels or enhancing promotional visibility can improve sell-through rates by nearly 24%.
Tracking engagement signals also reveals preferred product features, enabling brands to differentiate beyond pricing. Instead of competing solely on discounts, retailers refine positioning strategies based on measurable buyer behavior, improving long-term marketplace performance.
How Web Data Crawler Can Help You?
In today's competitive marketplace, data accuracy determines performance. Implementing Cdiscount Data Scraping for Marketplace Sales Trends Analysis with us enables structured monitoring of category shifts, pricing changes, and product demand metrics at scale.
We provide:
- Automated daily listing monitoring.
- Competitor price change alerts.
- Category growth trend dashboards.
- Review and rating tracking systems.
- Inventory availability tracking.
- Custom analytics reporting solutions.
Our solutions are designed for scalability, ensuring reliable data extraction without marketplace disruption. From small sellers to enterprise retailers, we tailor intelligence frameworks aligned with your business objectives.
With advanced automation capabilities, including Cdiscount Marketplace Data Extraction, our team ensures high-accuracy datasets that support strategic pricing and merchandising decisions.
Conclusion
Strategic retail growth requires structured marketplace intelligence. By adopting Cdiscount Data Scraping for Marketplace Sales Trends Analysis, sellers improve forecasting precision, optimize pricing, and align inventory with real-time demand signals.
Integrating solutions such as Cdiscount Product Pricing Data Scraper enables brands to move from reactive decisions to predictive strategies. As competition intensifies across online marketplaces, data-backed decision-making becomes essential for long-term profitability. If you're ready to elevate your marketplace analytics strategy, contact Web Data Crawler now to start building smarter, data-driven marketplace strategies.