


How Blinkit vs Zepto Pricing Comparison Using Web Scraping Reveals 20% Price Gaps Across Products?
Sep 10
Introduction
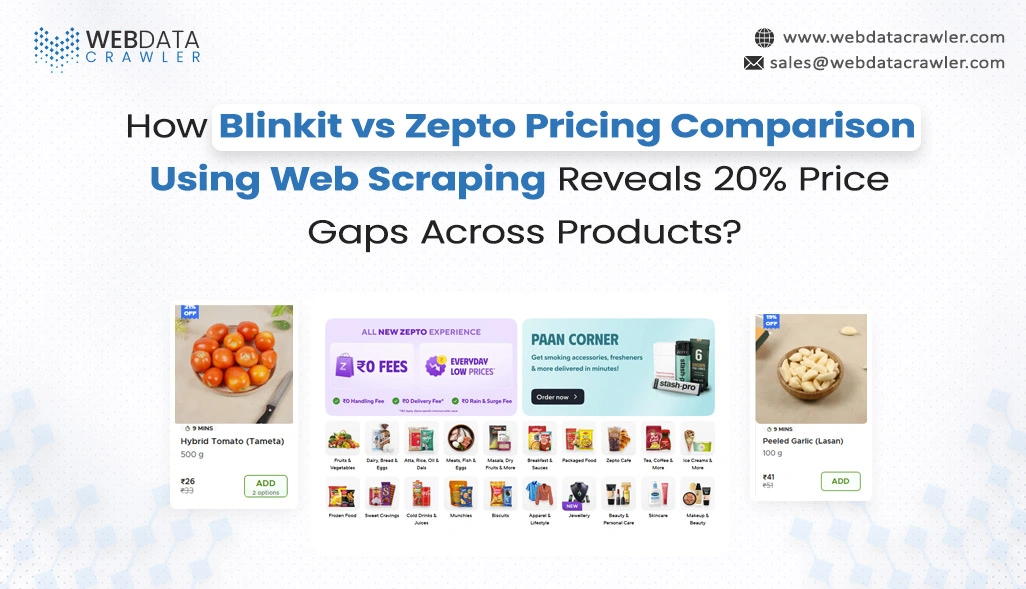
Quick commerce platforms frequently adjust grocery prices based on demand, location, inventory, promotions, and delivery conditions. These frequent changes can create noticeable differences between competing platforms. Web Scraping Zepto Grocery Data provides structured information that helps businesses evaluate product-level pricing patterns and understand how rapidly grocery prices fluctuate.
A structured Blinkit vs Zepto Pricing Comparison Using Web Scraping can reveal meaningful price differences across common grocery categories. A comparative analysis of 10,000 products may identify average price gaps approaching 20%, particularly across packaged foods, beverages, household essentials, and personal care products.
These variations create opportunities for retailers, brands, researchers, and pricing teams to evaluate competitive positioning more accurately. By collecting product names, prices, discounts, availability, pack sizes, and promotional information, organizations can build consistent datasets and compare pricing movements across multiple quick commerce platforms.
Mapping Grocery Price Differences Across Competing Quick Commerce Platforms
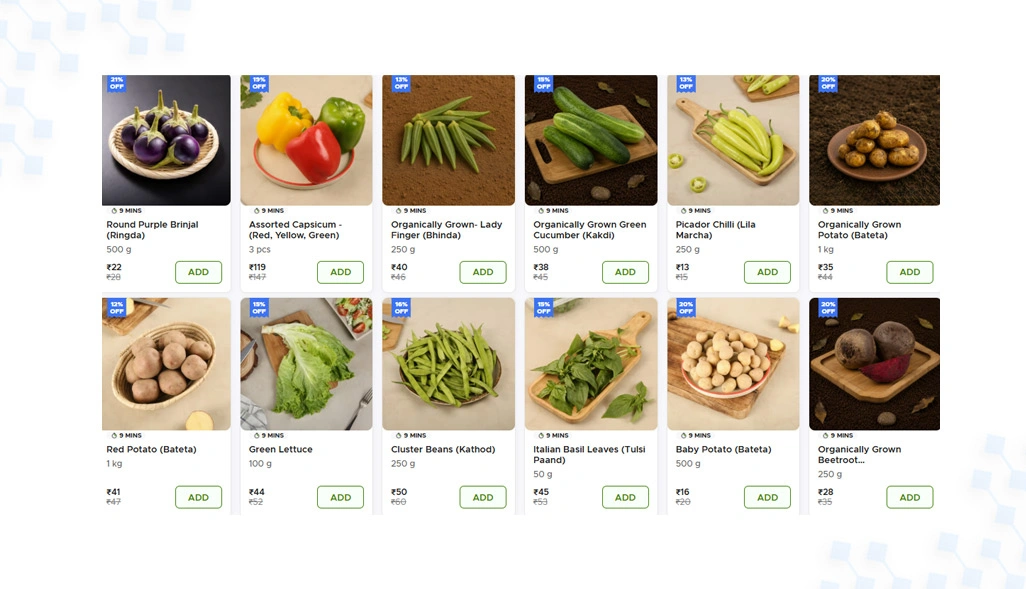
Price comparison becomes more meaningful when products are normalized according to category, brand, pack size, location, and selling conditions. Automated collection can capture these attributes at regular intervals, helping analysts establish comparable records across thousands of products. Scrape Blinkit Grocery Data for Insights can support this process by organizing product-level observations into structured records for pricing research.
Price gaps can vary substantially between categories because promotional intensity, inventory availability, and consumer demand influence final selling prices. Web Scraping Blinkit Quick Commerce Data can provide repeated observations of listed prices, discounts, stock conditions, and product details. For instance, a sample containing 10,000 comparable SKUs could show an average difference of approximately 20%, while selected promotional products may experience considerably larger fluctuations.
Grocery Category, Products Compared, Average Price Gap, and Typical Variation:
| Grocery Category | Products Compared | Average Price Gap | Typical Variation |
|---|---|---|---|
| Packaged Foods | 2,500 | 18.4% | 8–27% |
| Beverages | 2,000 | 21.1% | 10–31% |
| Household Essentials | 2,700 | 19.2% | 7–29% |
| Personal Care | 2,800 | 20.6% | 9–33% |
Analysts can strengthen the comparison by maintaining recurring snapshots instead of collecting information only once. This approach shows whether a pricing difference remains consistent or disappears after a promotion ends. It also helps separate genuine competitive pricing behavior from temporary discounts, stock-related adjustments, and location-specific offers.
Key comparison activities include:
- Standardizing product names and pack sizes
- Recording regular and discounted prices
- Monitoring product availability
- Comparing category-level price movements
- Tracking promotional frequency over time
When these records are reviewed together, businesses can identify categories with persistent price differences and products requiring closer observation. The resulting information supports competitive benchmarking, pricing research, assortment evaluation, and more informed decisions around promotional strategies.
Tracking Historical Price Movements Across Comparable Product Sets
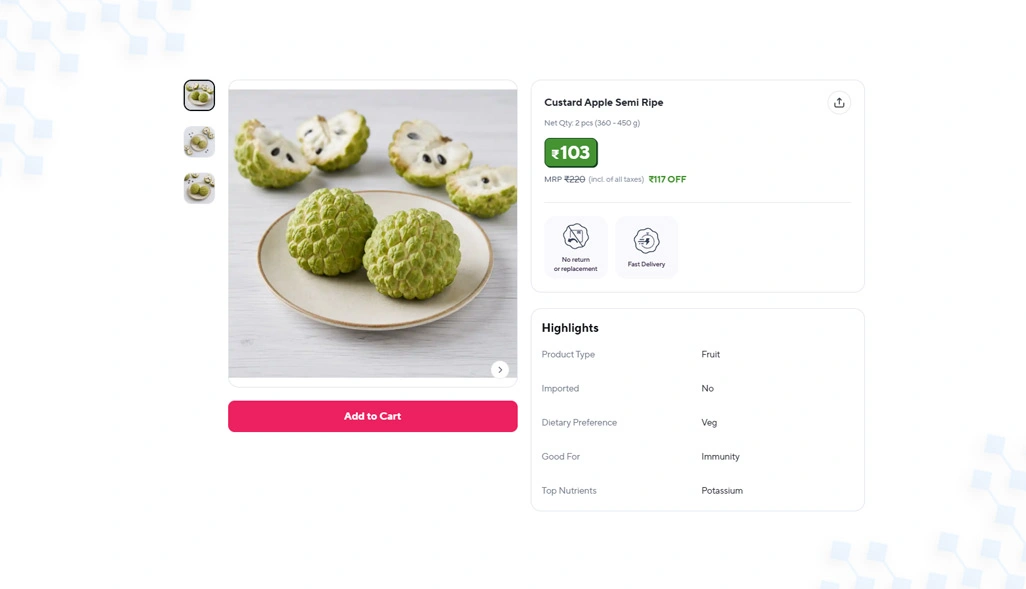
Historical monitoring provides greater context than a single price comparison because quick commerce prices can change multiple times during a day. A Zepto Quick Commerce Dataset containing repeated product observations can help analysts evaluate how frequently prices move and whether changes follow recognizable patterns. Tracking 8,000 products over four weeks, for example, could show that around 22% experienced at least one significant price adjustment.
Price histories also make it possible to compare regular selling prices with promotional values. This distinction matters because a temporary discount may create an apparent competitive advantage that does not represent the platform's normal pricing position. Extract Zepto Grocery Delivery API can complement structured data workflows where appropriate data access is available, helping teams organize relevant product information for downstream analysis.
Metric and Sample Observation:
| Metric | Sample Observation |
|---|---|
| Products Tracked | 8,000 |
| Monitoring Period | 4 Weeks |
| Products With Price Changes | 22% |
| Average Discount Variation | 16.8% |
| Frequently Updated Categories | 5 |
A broader comparison can also incorporate delivery areas, stock availability, brand names, pack quantities, and promotional labels. These attributes help analysts determine whether a price difference originates from product configuration or an actual pricing strategy. Location-based observations are especially useful because the same SKU can show different prices depending on the selected service area.
Important historical monitoring activities include:
- Capturing recurring product snapshots
- Recording price changes by date
- Comparing promotional and regular prices
- Measuring category-level fluctuations
- Identifying frequently changing SKUs
Historical records become more valuable when they are maintained in a consistent structure. Analysts can calculate average prices, price-change frequency, discount depth, and category variations over time. This creates a stronger basis for evaluating competitive movement and determining which products or categories deserve continuous monitoring.
Converting Cross Platform Price Variations Into Market Intelligence
Pricing data becomes more actionable when individual observations are connected with product availability, discounts, brands, categories, and pack sizes. A Blinkit Quick Commerce Dataset can provide historical records that help businesses benchmark thousands of SKUs across different grocery segments. Monitoring 12,000 products weekly, for example, could expose recurring differences that would be difficult to identify through manual checks.
Cross-platform analysis can also benefit from broader competitive information. Instacart Account Scraping for Analyze can support comparative research involving additional grocery marketplace information when data access and applicable requirements permit. Adding another reference point allows analysts to evaluate whether a pricing gap is isolated between two platforms or reflects a wider market pattern across multiple grocery channels.
Analysis Area and Potential Finding:
| Analysis Area | Potential Finding |
|---|---|
| SKUs Monitored | 12,000 |
| Average Price Gap | 20% |
| Weekly Price Checks | 4 |
| Discount Range | 5–40% |
| Availability Coverage | 90%+ |
The collected records can reveal which products consistently maintain higher or lower prices, which categories experience frequent promotions, and where availability influences competitive positioning. These insights can be combined with historical observations to identify recurring patterns and distinguish short-term fluctuations from longer-term pricing behavior.
Useful analytical activities include:
- Ranking products by price difference
- Measuring promotional intensity
- Comparing category-level movements
- Monitoring availability changes
- Identifying recurring pricing patterns
A structured dataset can ultimately support dashboards, market research, pricing reviews, and assortment decisions. Instead of treating each price observation independently, businesses can evaluate relationships between pricing, promotions, availability, and product attributes. This creates a clearer view of competitive dynamics and provides a practical foundation for recurring quick commerce analysis.
How Web Data Crawler Can Help You?
Quick commerce pricing changes require consistent collection, normalization, and monitoring across product pages. Blinkit vs Zepto Pricing Comparison Using Web Scraping can be supported through automated workflows that capture product information at scheduled intervals. We can organize large volumes of grocery records into structured datasets while maintaining fields such as product names, prices, discounts, availability, brands, categories, and pack sizes.
We can support structured data collection and processing across large product inventories. The workflow can capture product names, prices, brands, categories, pack sizes, discounts, availability, and other relevant attributes according to the required dataset structure.
Key capabilities include:
- Automated product information collection
- Scheduled price monitoring
- Structured product attribute extraction
- Historical dataset development
- Data normalization across product categories
- Scalable processing for large inventories
These capabilities can help businesses maintain consistent records for competitive research and recurring pricing analysis. Scrape Blinkit Grocery Dataset can further support detailed product monitoring by converting collected information into organized, analysis-ready records. Such datasets can feed dashboards, research projects, internal analytics systems, and pricing intelligence workflows.
Conclusion
Frequent pricing changes across quick commerce platforms make structured competitive monitoring increasingly valuable. Consistent data collection creates a practical foundation for ongoing market analysis. Blinkit vs Zepto Pricing Comparison Using Web Scraping can help organizations evaluate pricing behavior at scale, while structured datasets support more accurate benchmarking across grocery categories.
Historical datasets also provide stronger context for evaluating promotional strategies and competitive positioning. Scrape Blinkit Grocery Data for Insights can further contribute to recurring product-level analysis and competitive monitoring. Contact Web Data Crawler today to build a reliable quick commerce pricing dataset tailored to your business and research requirements.